
So many CMOs are under pressure right now to demonstrate tangible results, particularly those that have a Private Equity (PE) backing. For this reason, we invest alot of energy in our own agency into executive level dashboards.
Here are some key lessons learned from collapsing multiple funnels into one source of truth that we have learned over the last decade.
First, there is no right answer here – much of this depends on your Go To Market motion, the relationship you have with your board, their understanding (or lack thereof) of Marketing, and what is needed from your CEO. So use this as a framework to creating your board slides.
3 Key Principles for Board Slides:
1. Start with market context before details: Create a slide that establishes market size and engagement before diving into marketing metrics. This helps level-set with the board about total addressable market and creates context for your performance data/. This is what we’d include – and is more relevant if you are a newer CMO to the role.
Market potential visualization:
- Total addressable market (e.g., 10,000 companies)
- How many you’ve identified but aren’t talking to
- How many marketing is engaged with
- Current pipeline
This shows you have command over the Market dynamics.
2. Focus on pattern recognition: Board members are looking for pattern recognition. They don’t understand the minutiae of the business. One of our CMO clients found that they needed to answer two core questions upfront: “Did you hit your target? How does your pipeline look?”
3. Use a narrative arc: think of your 1-3 year business plan as a novel, and each board meeting as a chapter. This helps frame your metrics within a larger story about business progress.
Specific Slide Examples and Approaches:
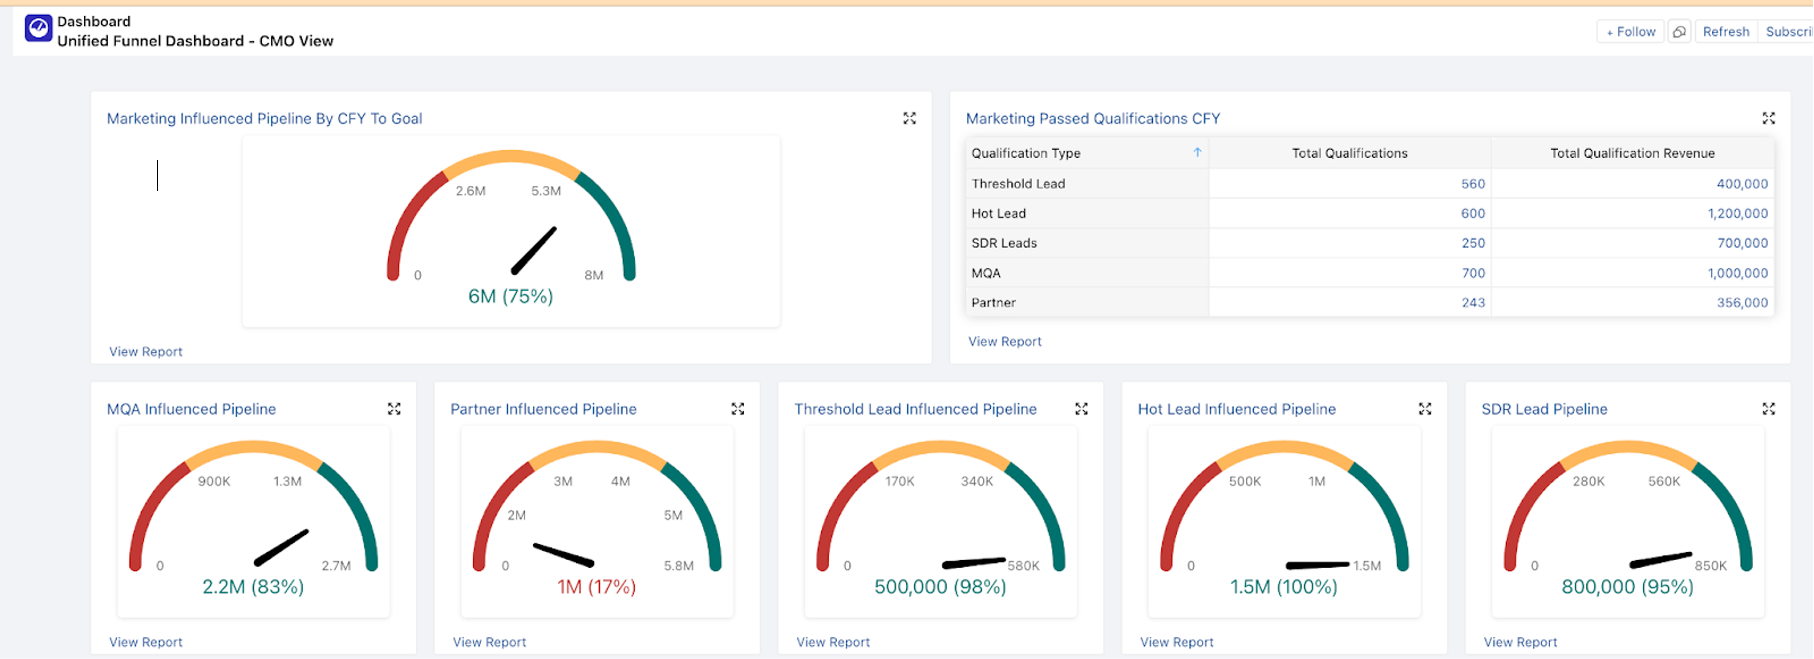
1. Funnel conversion summary: One example is to share a simple slide showing conversion ratios across the entire funnel (MQLs to meetings to pipeline to closed-won). This made it easy to explain performance and sparked productive conversations about areas for improvement. This conversion should mirror what you are displaying as a snapshot of your performance in your CRM system – here is a redacted example of what we built for a client:
2. Current customers: This helps frame the opportunity and marketing’s progress with upsell and cross sell opportunities.
3. Pipeline health dashboard: Another approach that we heard includes looking at pipeline through three lenses: clean, healthy, and sufficient – examining not just volume but quality indicators like multi-contact opportunities and activity levels
Finding the Right Balance – some other tips we’ve learned:
1. Use headers effectively: Include clear takeaways in slide headers so board members can quickly grasp the point without getting lost in details.
2. Layer your data: Present top-level metrics on the main slides, with supporting details available if questions arise.
3. Connect to business outcomes: Always tie marketing metrics back to revenue impact and business goals.
4. Avoid marketing jargon: Use business language rather than marketing-specific terms that might confuse board members.
These are some of the key lessons learned from board level reporting over the last decade.
If you’d like, please message me, I’d be happy to walk you through an example of a dashboard that supports this board level reporting that unifies a single view to your executive team on marketing performance.